
For Concept2 founders Peter and Dick Dreissigacker, the real fun begins when they take a theoretical idea and get it on the water. As accurate speed metres became available, systematic on water testing became much more effective, and over the years, Peter and Dick have gathered results from over 200 days of testing. The first outcome of these tests was the development of the Big Blade shape in 1991, and the innovations keep coming. According to Peter and Dick, testing is the part they enjoy most.
Read on for Peter and Dick’s test procedure, which you can use to conduct your own speed testing, and how they evaluate results. Peter and Dick’s tests have shown that there are performance differences between blade shapes, but it is important to keep the following in mind:
- Performance differences depend on various factors such as rigging, catch angles, power application, and so on.
- Ultimately, crews need to determine for themselves what works best for them.
Conducting the Test
Peter and Dick use the following procedure when conducting speed testing:
- During testing, row at least six pieces, switching between the two oars or sets of sculls for each piece. Do as many pieces as possible to see if a pattern evolves.
- Do not change anything other than the oars being tested. If you change other factors during a test, you will not know which change made the difference.
- Row all pieces at maximum effort, because it is easier to be consistent. Avoid testing with longer pieces, as they require pacing and other factors that could skew your testing results.
- Timing accuracy is critical, and timing a fixed number of strokes (versus timing a distance) is the most accurate method. Set the speed metre so that you have 10 strokes to get up to speed, then start recording speed data for the next 40 strokes.
If you choose to time a distance, make sure it’s at least 500m. This minimizes the effects that result from differences as to when a piece begins and ends relative to the stroke cycle. - Do not look at any results until all pieces are complete, as knowing the results during the test may affect your performance. Cover the speed portion of the display with a piece of tape during testing.
- Only test during calm conditions, and row all pieces in the same wind direction. Changes in a tailwind have less effect than a headwind.
Evaluating Results
Peter and Dick use the following principles to evaluate results:
- Graph the results and calculate the difference in speed as a percentage.
- Because day-to-day variation is too great, stick to comparing trials that were done on the same day.
- Test the same variable several days before making a conclusion.
- Keep in mind that test results only apply directly to the crew doing the testing.
Here are some examples from Peter and Dick’s testing.
Smoothie1 vs. Big Blade
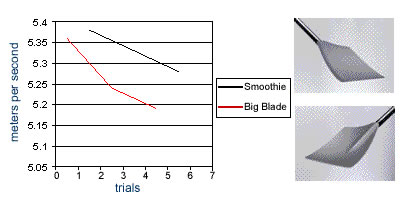
Typically, blades had been made symmetrical about the shaft. The idea behind the Smoothie1 blade was to make a truly asymmetrical blade designed to fit the path of the blade through the water during the first phase of the stroke. We also adjusted the curvature and tip angle.
The following graph shows the speeds of the test pieces. On the graph, the Big Blade is red and the Smoothie1 is black. The Smoothie1 pieces were faster by 1.2%.
Note: The Smoothie1 blades were eventually refined and re-released as the Smoothie2 Plain Edge and Smoothie2 Vortex Edge blades we sell today.
Smoothie1 vs. Smoothie1 with Rounded Tip
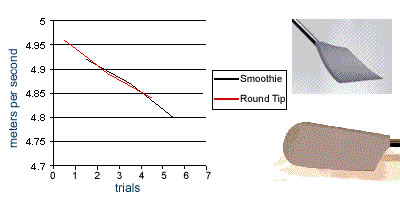
This test was between the Smoothie1 and a Smoothie1 with a rounded tip. This testing focused on investigating the delta wing effect. We tried various delta tip shapes over the season, which led us to the rounded tip, because it gave us the best results during the delta tip trials.
The following graphs the speeds of the test pieces. The round tip is red; the Smoothie1 is black. The speed of these two designs was the same in our tests; however, the feel of the oar was greatly changed by the tip profile. With the rounded profile, the oar was rowed one centimeter shorter and still felt like a heavier load during phase 2. This would suggest improved efficiency in phase 2. The lack of a speed increase may be due to a decreased effectiveness in other parts of the stroke, perhaps phases 1 and 3.
Note: The Smoothie1 blades were eventually refined and re-released as the Smoothie2 Plain Edge and Smoothie2 Vortex Edge blades we sell today.
Smoothie1 Vortex Edge vs. Smoothie1 Plain Edge
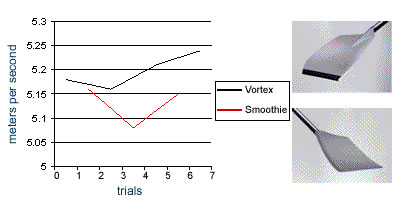
The addition of the Vortex Edge was an attempt to gain improvement during phase 2 without losing efficiency in other parts of the stroke. To gain improvement during phase 2, some taper was added along the sides of the blade to increase the delta wing effect. To gain improvement during phase 1, vortex-generating features were also added to the low-pressure (or back) side of the tip.
In the graph of results below, the Smoothie1 Vortex Edge blade is black, and the Smoothie1 Plain Edge blade is red. Pieces done with the Vortex Edge blade were 1.3% faster.
Note: The Smoothie1 blades were eventually refined and re-released as the Smoothie2 Plain Edge and Smoothie2 Vortex Edge blades we sell today.
Fat2 vs. Smoothie2 Vortex Edge
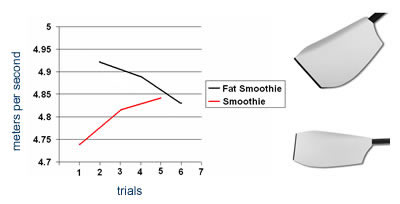
This test was to investigate what efficiencies could be gained by using a wider blade. The Fat2 blade is about 2 cm wider, the additional surface area specifically intended to target improved efficiencies during the third phase of the stroke. The Fat2 blade also features a Vortex Edge.
The numbers showed a 1.5% advantage with the Fat2. Although the result may have been exaggerated by a poor first piece of the day, testing showed a definite trend for the Fat2 to out-perform the Smoothie2 Vortex Edge.
Fat2 Blades on Skinny Scull Shafts vs. Fat2 Blades on Ultralight Shafts
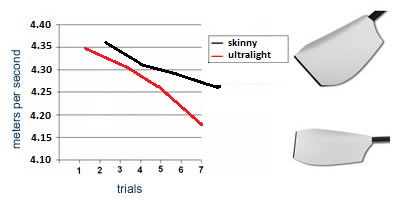
This test, done by a single sculler, compared results using the same Fat2 blades on Skinny and Ultralight shafts. Speeds for pieces with the Skinny shaft are consistently faster. During the test a slight headwind developed, which is not ideal for a test day, but the larger difference in speed at the end of the test is a possible indication that the decreased wind drag of the Skinny shaft contributed to the speed advantage.